Hypothesis 1
The use of the term “diversity” and related terminology increased in biomedical abstracts
Over the past several years, social scientists have noted that the discourse of “diversity” is expanding in use across various organizations (Berrey 2015; Ray 2019). While these authors speak to the discourse of diversity being a mechanism for domininant (white) racial groups in power to pay lip service to racial inequity without addressing these problems through the reallocation of resources, our interest in diversity is to better understand how it is used in biomedical research. Specifically, we are interested in eventually understand how diversity may or may not be replacing the discourse of race and ethnicity. First, we need to establish how often diversity is used within biomedical research. On this page, we are interested in measuring how often diversity and its various metonyms (i.e. related phrases) are used in biomedical research over the past three decades (1990-2020). Before getting started, we posed a working hypothesis to guide our work:
has increased in biomedical abstracts from 1990-2020.
To test Hypothesis 1, we opted to use a supervised text mining approach that depends on the use of a nested dictionary. This basically means that we constructed several dictionaries of terms that can be classified into 11 different categories of diversity: ancestry, cultural, disability, diversity, equity/justice, lifecourse, migration, minority, race/ethnicity, sex/gender, and sexuality. Within each of these categories, there are 6-104 different terms that are of interest to us. For a full list of terms in each category, you can search the Supplementary Tables below or see a hierarchical visualization of the dictionaries on Methods page.
Once these dictionaries were aggregated, we developed a strategy that (1) counted how often each of the terms within each category were mentioned in biomedical abstracts each year and (2) then calculated what percentage of the overall abstracts that the terms arose within to control for the overall rise in publications over time (see Supplementary Analyses). Below, we provide a simple description of the variations in term usage while our manuscript provides a more detailed analysis of the implications for our broader arguments.
Importantly, as we document in our methodology, measuring “diversity” is somewhat complicated by the fact that it is a polysemous concept - meaning that diversity itself has multiple meanings. Specifially, in biomedical research, diversity more commonly means heterogeneity than referring to a form of social representation or relating to a matter of addressing equity, inclusion, or justice. Thus, in the figure below, you will see two diversity trends. First, “diversity (all)” refers to all means of terms in the diversity category. On the other hand, the “diversity (social)” category was classified using a custom algorithm that we developed to identify mentions of diversity in the context of social justice and inequity issues. Though we detail the development and technicalities of this algorithm in our Appendix below, “diversity (social)” basically refers to all mentions of diversity that (1) co-occur in the same sentence as terms from any of the other 11 H1 categories, (2) co-occur along frequent group labels (e.g. group, cohort, participant, etc.), and (3) do not co-occur alongside more general forms of heterogeneity related to the concept of diversity For example, if diversity is mentioned alongside race or gender, diversity will be classified as a form of “social diversity.” In this case, the term will be counted in both lines displayed in the graph. If diversity is not mentioned alongside any of the other diversity terms in our dictionaries, it will only be included in the “diversity (all)” line.
Figure 1A also demonstrates the difference between undifferentiated and social uses of diversity. Somewhat surprisingly, the social uses of diversity only comprise a fraction of all mentions of diversity in any given year - starting at 2% in 1990 and growing to 10% in 2020. While the general form of diversity was ranked fourth behind age, sex/gender, and socio-economic terms in the 2020 rankings (with an 18-fold increase), the social variant ranked lowest, but exhibited the largest overall increase with a 67-fold rise since 1990. We caution readers that this count may be somewhat inflated (see Table 2 in the manuscript). However, there is no reason to suspect that this variation should bias the observed longitudinal trends. We also detected growth in socio-economic and racial/ethnic terms, jumping 16- and 14-fold respectively. Although the ancestry, minority, and sexuality categories all increased over time, this growth was more subdued, tapering off by the end of the period.
To normalize for the growth of overall publications, we look at change in the proportion of available abstracts. Figure 1B shows that the rise in lifecourse and sex/gender terms are still quite robust. The other growth trends are obviously much more subtle. Diversity (all) increased by about 2.45% while diversity (social) is still mentioned in less than 1% of all abstracts by 2020. While this percent change of this category is more marked than the race/ethnicity category, the terms in the latter category are still referenced more often overall. Of the remaining categories, the socio-economic category is the only other that has seen noticeable change (up around 3.2%). That said, it is still somewhat surprising to see a “fundamental” cause of health disparities mentioned so rarely in our sample of biomedical abstracts (Link and Phelan 1995; Phelan et al. 2010).
Main Takeaways
Overall, we see robust support for Hypothesis 1 - that “diversity” is on the rise in biomedical research. Lifecourse and sex/gender terms have shown the most marked increases over time - mentioned in roughly 27% and 18.5% of all abstracts respectively. While race/ethnicity has risen slightly since 1990, these terms have mostly stagnated since the year 2005. Since then, the use of diversity in its “social” sense has risen almost 70-fold, but is still only used in ~1% of all abstracts. These analyses also show the importance of accurately measuring diversity in context. Hopefully, the dictionaries and software tools developed in this project will help other researchers examine diversity in other contexts as well.
Appendix
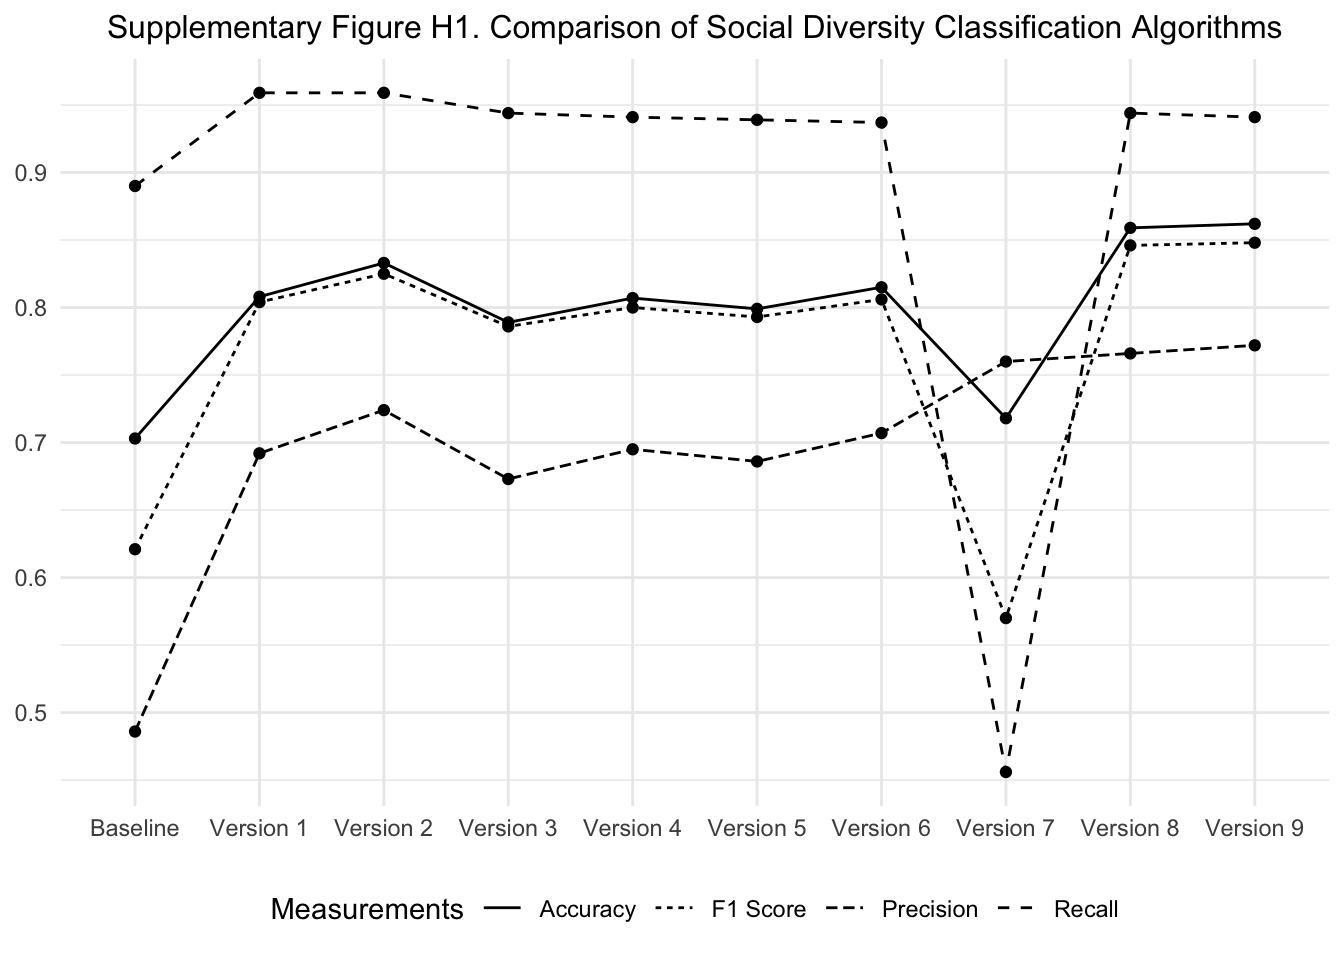
To measure “social diversity” in biomedical abstracts, we developed a series of algorithms to detect the mentions of diversity that reference human forms of diversity rather than general heterogeneity or biodiversity. Our initial specification of this algorithm (the Baseline model) counted any mention of the term diversity that was used in the same abstract as any of the other terms in the other 11 categories. After running these tests, we hand-coded an initial set of 500 abstracts that mention “any diversity” and 500 that mentioned “social diversity” more specifically. This baseline version garnered a very low F1 score - mainly because the precision was only around 46%, meaning that we have an extremely high false-positive rate. To address this limitation, we developed eight different comparison algorithms, making small tweaks in each step, and then having two research assistants hand-code 500 abstracts from each of the “all diversity” and “social diversity” samples. Overall, our inter-rater reliability was ~91% between the two coders with any discrepancies being resolved by a third coder (the second co-author).
The first step we took was to improve our nonhuman exclusion clause. In the Baseline run, we had a fairly small list of 237 nonhuman terms and only removed abstracts if they mentioned animals and did not mention humans. To improve this, we increased the nonhuman list to 1,117 terms. Obviously, this step provides the largest improvement in our testing series (see Baseline to Version 1).Second, we reduced false positives by eradicating common forms of polysemy related to bioecological, cellular, and methodological diversity as well as general forms of heterogeneity. These patterns were extracted using R’s tidytext package to extract n-grams of “diverse [terms],” “diversity of [terms],” and “[terms] diversity.” Alone, this function makes only a marginal difference, but with the animal exclusion clause do see notable improvements (see Baseline to Version 2).
Next, we tried implementing an even more stringent nonhuman exclusion clauses. Rather than removing all abstracts that mention nonhumans and did not mention humans, we kept only abstracts that mention humans and removed all that mention animals in Version 3 while adding the polysemy adjustment function in Version 4. Following a similar logic, we also removed any abstract than mentioned nonhuman terms in Version 5 with a polysemy adjustment in Version 6. Much to our surprise, these versions diminished predictive capacity slightly, but opted to keep this version in our final algorithm to minimize the potential of having false positives in animal studies.
Hypothesis 1 Dictionary
Here is a list of the terms in each category analyzed above. You can scroll through each category or use the search tool to see if a term of interest was used in the analyses.
Top Terms Resulting from H1 Anaylses
References
Berrey, E. (2015). The Enigma of Diversity. University of Chicago Press: Chicago, IL.
Link, B. G., & Phelan, J. (1995). Social conditions as fundamental causes of disease. Journal of Health and Social Behavior, 80-94.
Phelan, J. C., Link, B. G., & Tehranifar, P. (2010). Social conditions as fundamental causes of health inequalities: theory, evidence, and policy implications. Journal of Health and Social Behavior, 51(1), S28-S40.
Ray, V. (2019). A theory of racialized organizations. American Sociological Review, 84(1), 26-53.